Overview
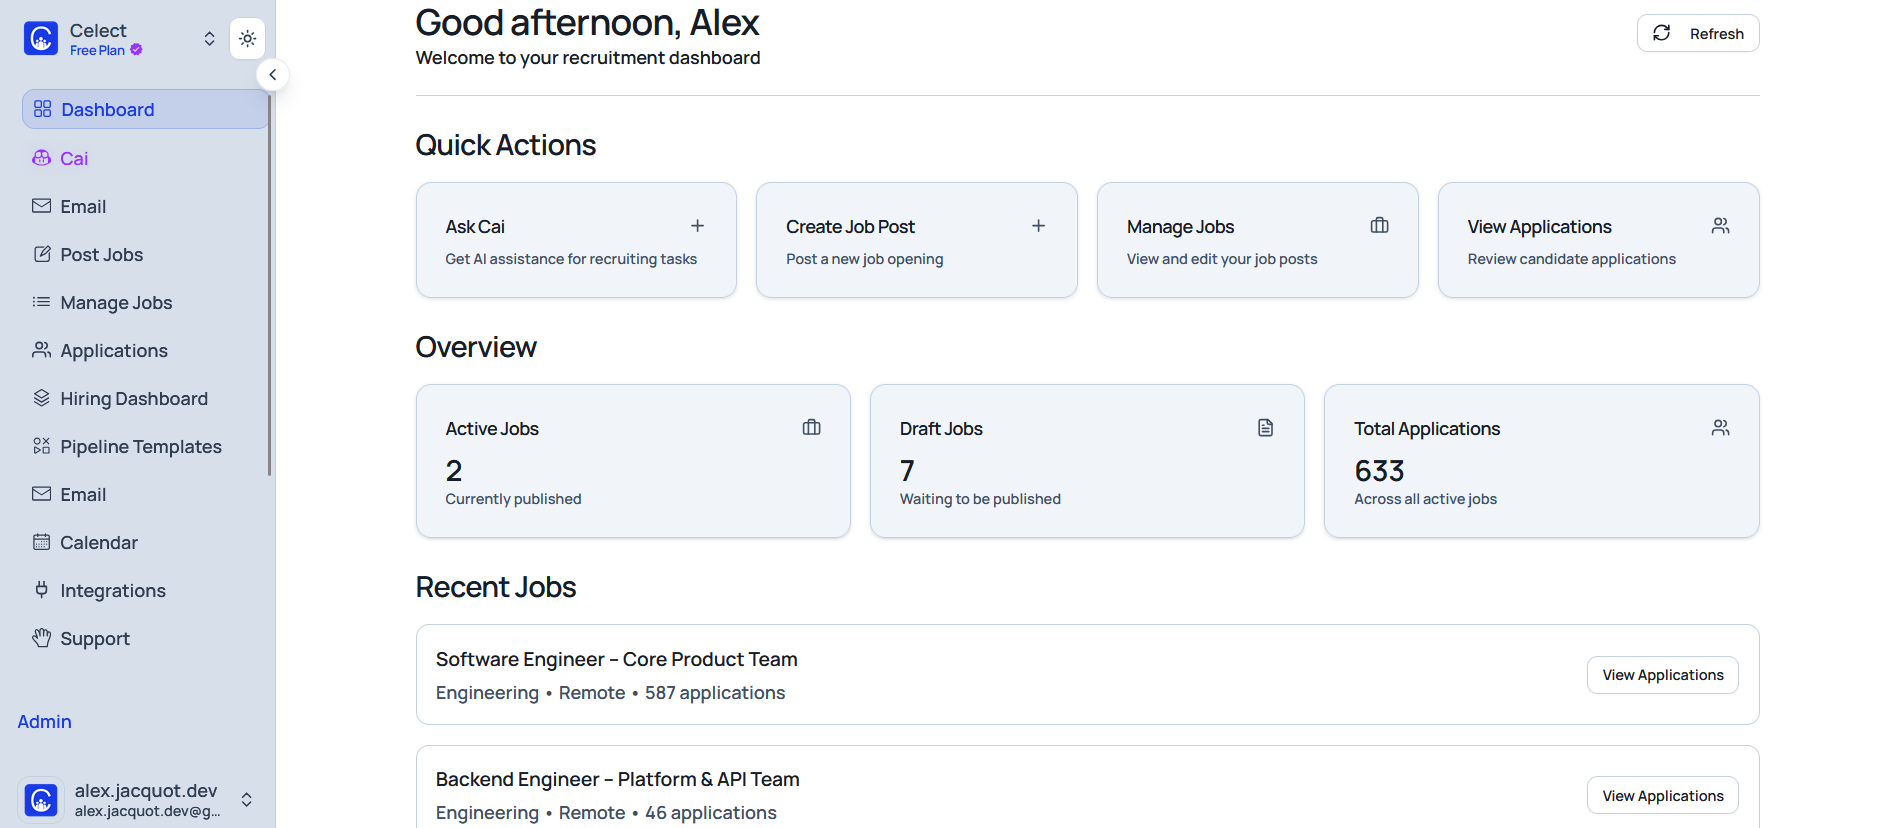
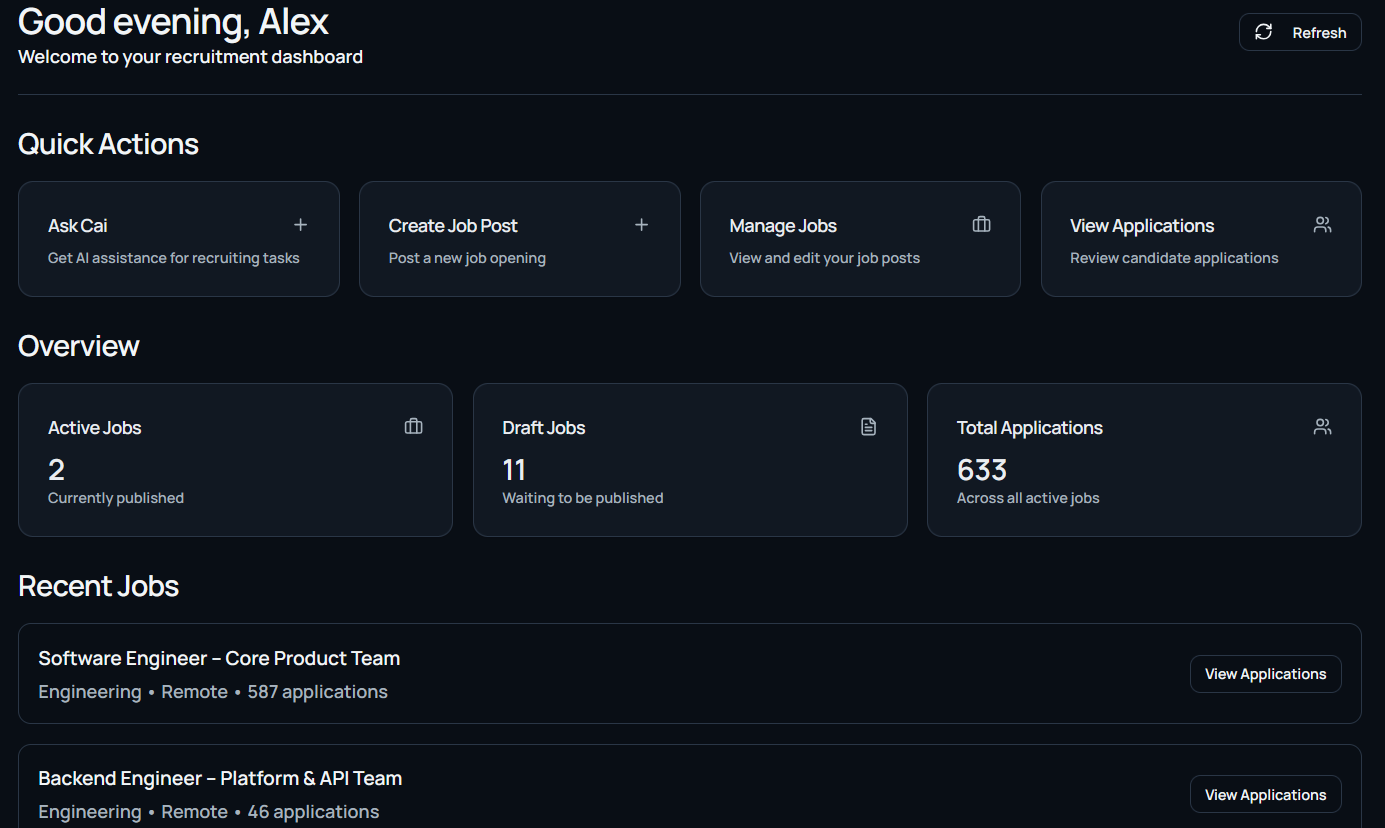
The dashboard is the homepage for your organization inside Celect. It surfaces a high-level snapshot of recruiting activity and platform usage so you can check performance at a glance without diving into management tasks.
Key Functions and Data
Active Jobs Summary
Shows the count of currently active job postings. Selecting the widget opens Manage Jobs with the view filtered to active roles.
Candidate Pipeline Overview
Displays visual indicators or counts for how many candidates sit in each stage of your hiring pipelines.
System Usage Stats
Highlights subscription usage and activity metrics, including:
- Number of jobs posted this month
- Number of candidates processed
- Remaining usage against your plan limits (for example, job posts remaining)
Time to Hire
Calculates the average number of days from application to hire, with both organization-wide and role-specific breakdowns when available.
Funnel Chart
Visualizes how candidates move from application through interviews to eventual hires, making pipeline health easy to scan.
Source of Hire
Summarizes where candidates originate (for example, LinkedIn, Google, referrals) using charts for side-by-side comparison.
Stage Time
Shows the typical amount of time candidates remain in each hiring stage (for example, Initial Interview = 3 days) so you can spot bottlenecks.
Monthly Activity
Tracks applicants, interviews, and hires each month to reveal hiring trends over time.
Quick Links or Shortcuts
Provides one-click buttons to jump into:
- Posting a new job
- Viewing the pipeline
- Accessing the candidate list
- Managing the subscription